When deciding on a PV solar system customers are faced with the question of optimal module technology or “Which route is going to give me the best bang for MY buck?”.
Crucial for many customers is primarily that of high yield (power generated), measured in kWh (kilowatt hour) / kWp (kilowatt peak) produced. A kilowatt-hour (symbolized kWh) is a unit of energy equivalent to one kilowatt (1 kW) of power expended for one hour. Comparing yield results of various systems can support decision-making, since it allows direct comparison based on real data.
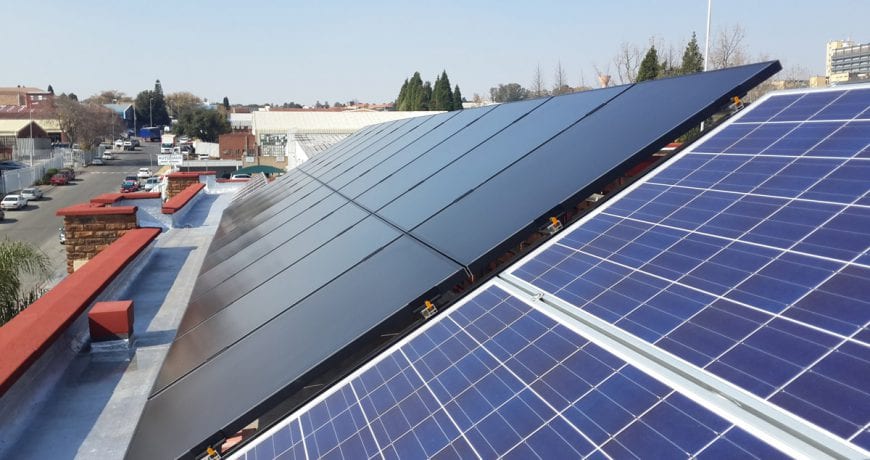
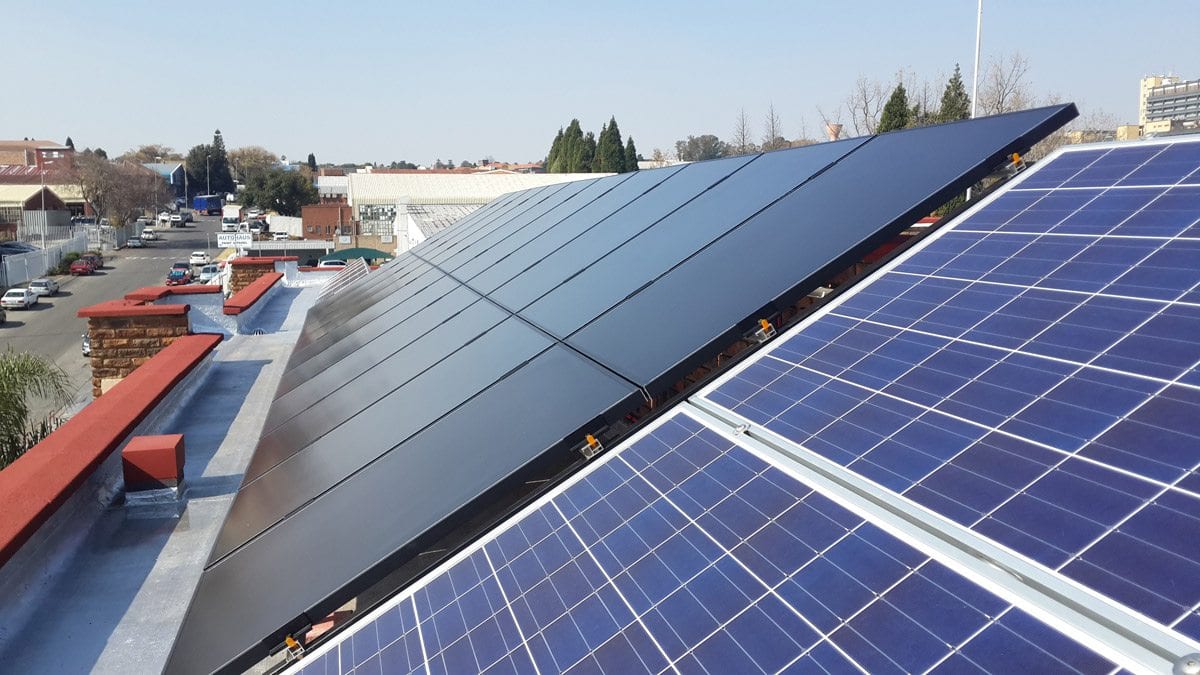
There has been no such real comparison possible in South Africa until very recently, when Herbert Teubner, GM of Sinetech, one of the oldest solar technology companies in South Africa, installed a custom comparison test system with three different module technologies at the company headquarters in Randburg, Gauteng. What’s more, the three systems are linked to a hi-tech weather reference station capturing a wealth of climatic data of the exact location.
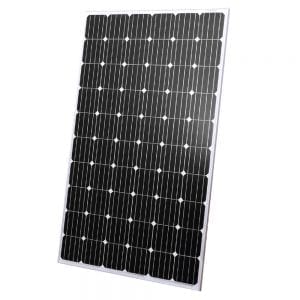
On the roof of the offices, Sinetech has installed three independent solar systems – one based on polycrystalline panels, one on monocrystalline and the third on CIS or thin-film panel technology, each with a 3KW/p output. Due to the different watts of the various panels in each test system, a set of 20 x CIS modules and 12 each of the mono- and polycrystalline modules have been installed. The total system capacity is therefore 9000W/p or 9KW/p.
The measurement results of the first three months are clear: under exactly the same conditions, slope angle and orientation of the modules, the thin-film CIS plant produced a 10.6% higher yield compared to the polycrystalline system, and as much as 10.8% increase in yield over the mono-crystalline system.
Teubner is delighted with the results: “With the test system, we wanted, regardless of the claims of the module manufacturer itself, to capture the energy production of the various technologies under the same installation and weather conditions in order to make a fair comparison.
“As we were limited in usable installation space, we used cutting-edge software to establish what was actually possible. We then decided what type of solar panels we actually wanted to compare.
“All three systems were installed and wired via individual combiner boxes, each with lightning protection, and finally fed into three identical grid-tie inverters. To guarantee a fair comparison, all PV panels were randomly selected from Sinetech’s own stock holding.”
The data generated from the weather station is an integral part of the entire PV system. All power and data cables terminate in Sinetech’s sophisticated data centre for power distribution and data processing. This data is used for establishing the maximum yield in Sinetech’s solar system designs and is also used for training purposes.
The data centre and weather station can produce a myriad of different displays, curves and readouts. The data has been made available free of charge to all universities and technicons around the country, and is also available to dealers by invitation.
For installers, this data represents a valuable sales tool: potential customers can make a direct comparison between the income potential (yield) of the different module technologies and this will help them decide which system is the most suitable for their location and the space available so that they achieve the highest possible yield.

